Tides and Currents
Understanding how water moves vertically and horizontally — and what that means for your boat
What Are Tides?
Tides are the periodic rise and fall of sea level caused by the gravitational pull of the Moon and, to a lesser extent, the Sun, acting on Earth's oceans. Understanding why tides form — not just that they do — is the foundation for predicting them accurately. test
The Moon exerts a gravitational force on everything on Earth, including the ocean. On the side of Earth facing the Moon, this force is strongest and pulls ocean water toward the Moon, creating a bulge of elevated water. On the far side of Earth, the Moon's gravitational pull is weakest, but the centrifugal effect of Earth and Moon orbiting their common center of mass creates a second bulge on the opposite side. The result: two tidal bulges exist simultaneously — one facing the Moon, one facing away. As Earth rotates through these bulges over roughly 24 hours, most coastal locations experience two high tides and two low tides each day.
The Sun contributes its own gravitational tidal force — but despite the Sun's enormous mass, it is so far from Earth that its tidal effect is only about 46% as strong as the Moon's. When the two align, their forces combine. When they oppose, they partially cancel. This is the origin of spring tides and neap tides.
The Lunar Day and Why Tides Shift Daily
The tidal cycle does not simply repeat every 24 hours. The Moon orbits Earth in the same direction Earth rotates, so the Moon appears to move slightly eastward against the sky each day. Earth must rotate a little more than 360 degrees to bring a given location back in line with the Moon — this takes about 24 hours and 50 minutes, not 24 hours. This extra 50 minutes is the lunar day.
The practical result: tides occur approximately 50 minutes later each day. A 0800 high tide today becomes a 0850 high tide tomorrow, 0940 the day after, and so on. After about two weeks, the pattern shifts enough that what was a daytime high tide is now occurring at night. Sailors planning passages around tide must account for this daily drift.
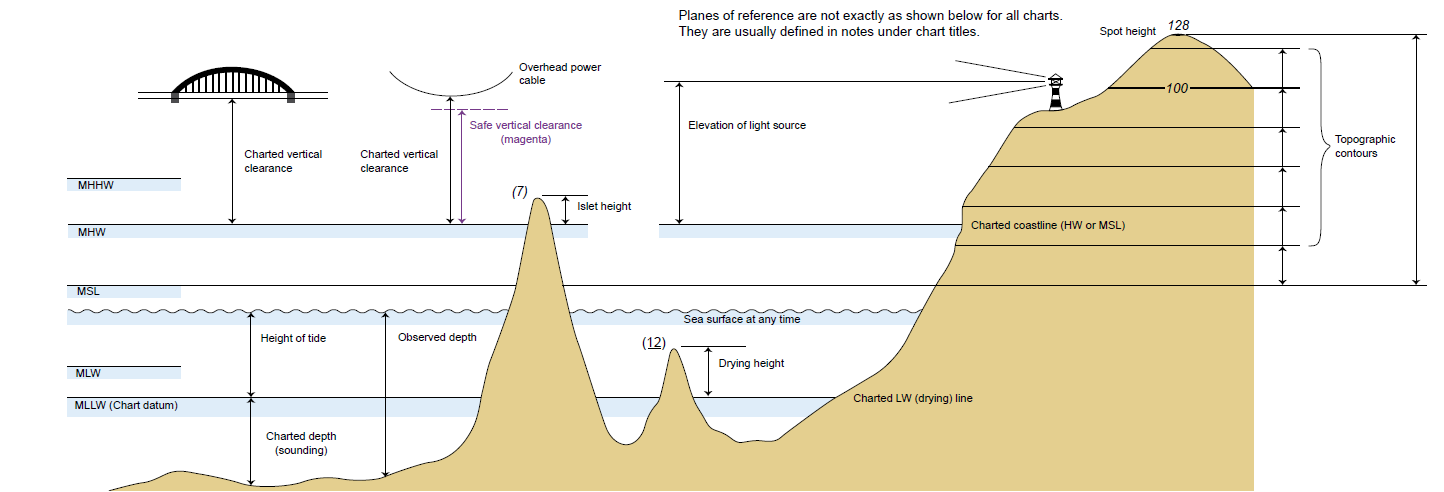
Chart Datum
Chart Datum is the reference level used on a nautical chart to measure all depths (soundings). It is not the actual water level you see; it is a consistent baseline, usually set close to the lowest predictable tide, such as Mean Lower Low Water in the United States. This conservative reference ensures that the depth shown on the chart is typically the minimum depth you can expect, helping mariners avoid running aground even under low-water conditions.
In practice, the real water depth at any moment is chart depth plus the height of tide above chart datum. That means tides, and in some cases wind-driven surge, can significantly increase or decrease the actual depth under your keel. Understanding chart datum is essential for safe navigation; it ties together your chart, tide tables, and real-world conditions so you can accurately determine whether you have enough water to proceed. In tide reports and predictions, values such as High Water and Low Water are reported as tidal highs and lows referenced to chart datum.
Always think of tide predictions as “layers on top of chart datum,” not actual water depths. When you see High Water or Low Water values in a report, you are seeing how far the sea surface rises or falls above Mean Lower Low Water. To find your real depth, simply add the predicted tide height to the charted depth. This quick mental step turns tide tables into a practical safety tool and helps you avoid surprises in shallow or restricted waters.
Tidal Datums
- MHHW (Mean Higher High Water): The average of the higher high water height of each tidal day.
- MHW (Mean High Water): The average of all high water heights; used for coastline and vertical clearances.
- MSL (Mean Sea Level): The arithmetic mean of hourly water level observations over a specific period.
- MLW (Mean Low Water): The average of all low water heights.
- MLLW (Mean Lower Low Water): The Chart Datum; the average of the lower low water height of each tidal day.
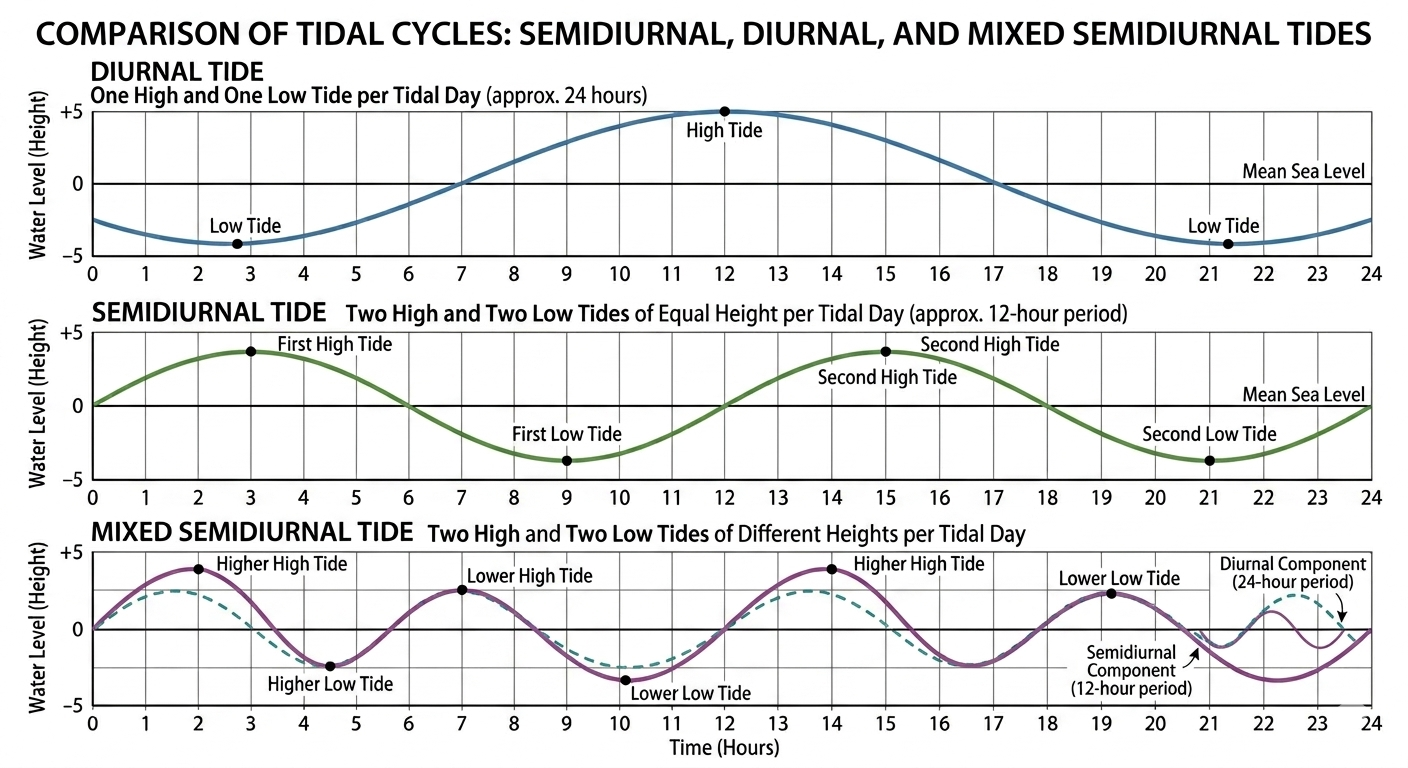
Types of Tidal Patterns
Not every coast experiences two equal high tides and two equal low tides per day. The tidal pattern at any location depends on the geometry of the ocean basin, local coastline shape, and the latitude. Chart No. 1 Section H and tide prediction tables make more sense once you understand which pattern applies to your area.
Semidiurnal tides produce two high tides and two low tides per lunar day, with the pair of highs being approximately equal in height and the pair of lows being approximately equal. This is the dominant pattern on the U.S. East Coast, most of the Atlantic, and much of the world. The tidal curve is smooth and symmetrical — predictable and relatively easy to work with.
Diurnal tides produce only one high tide and one low tide per lunar day. This pattern occurs in some Gulf of Mexico locations, parts of Southeast Asia, and other enclosed or semi-enclosed seas. Tidal range is typically small but the cycle is long — 24 hours and 50 minutes. Slack water lasts longer and tidal currents are generally weaker.
Mixed semidiurnal tides also produce two highs and two lows per day, but the heights are significantly unequal — a higher high water and a lower high water, plus a higher low water and a lower low water. The U.S. West Coast is a classic example. On a mixed coast, the difference between the higher high and the lower high can be several feet, and the two low tides are noticeably different. Tide tables distinguish between Higher High Water (HHW), Lower High Water (LHW), Higher Low Water (HLW), and Lower Low Water (LLW).
Why do tides occur approximately 50 minutes later each day?
The U.S. West Coast typically experiences which type of tidal pattern?
Spring Tides, Neap Tides, and the Lunar Cycle
The relative alignment of the Sun and Moon produces the most dramatic variation in tidal range that sailors experience from week to week. This alignment cycles over the approximately 29.5-day lunar month.
Spring tides occur at new moon and full moon, when the Sun, Earth, and Moon are aligned (a configuration called syzygy). During alignment, the Sun's tidal force and the Moon's tidal force act in the same direction, reinforcing each other. The result is larger-than-average tidal range: higher high tides and lower low tides. Spring tides occur twice per lunar month, roughly two weeks apart. The name has nothing to do with the season — it derives from the idea of tides that 'spring up.'
Neap tides occur at the quarter moons, when the Sun and Moon are roughly at right angles to each other relative to Earth. Their tidal forces partially cancel. Tidal range is smaller — the difference between high and low water is at its minimum. Neap tides also occur twice per month, between the spring tide peaks.
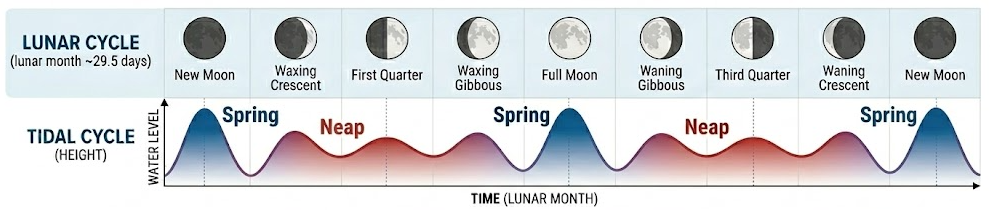
A simple check: look at the moon phase. Full moon or new moon means spring tides are at or near their peak — larger range, stronger currents. Quarter moon means neap tides — smaller range, weaker currents. This one observation tells you a great deal about what conditions to expect.
Perigean Spring Tides
The Moon's orbit around Earth is not a perfect circle — it is elliptical. When the Moon is at its closest point to Earth (perigee), its gravitational pull is stronger than average. When a spring tide coincides with the Moon at or near perigee, the result is a perigean spring tide: an exceptionally large tidal range, sometimes called a king tide.
Perigean spring tides can produce notably higher high waters and lower low waters than standard spring tides. These events are predictable months in advance and are published in tide tables. They are worth planning around: channels that are normally safe at low water may become dangerously shallow, and anchorages that are comfortable at high water may feel crowded if high water climbs well above normal.
Practical Effect on Navigation
Knowing where you are in the lunar cycle tells you immediately whether tides are building toward spring range or shrinking toward neap range. A boat that safely crossed a shoal at mid-tide during neap tides may touch bottom during the same mid-tide state at spring tides — because the overall tidal range has increased, meaning low water is lower even though the high is higher.
Spring tides also produce stronger tidal currents. More water moves in and out with each cycle when tidal range is large, so the current tables show higher maximum speeds at spring tide reference stations. Some passages that are straightforward during a neap tide become demanding or dangerous during a spring tide.
Local Geography: Why Tidal Range Varies So Dramatically
The astronomical forces driving tides are similar everywhere on Earth, yet tidal range varies from less than a foot in some enclosed seas to over 50 feet in the Bay of Fundy. Local geography, such as coastline shape, water depth, and basin resonance, shape how much the ocean surface actually rises and falls at any particular location.
Funnel-shaped bays and estuaries concentrate tidal energy. As the tidal bulge travels up a narrowing, shallowing bay, the same volume of water must fit into a progressively smaller cross-section. The water has nowhere to go but up. The Bay of Fundy in Nova Scotia is the most extreme example: its funnel shape and length produce tidal ranges exceeding 50 feet at its head. The Bristol Channel in the UK similarly produces ranges above 40 feet. By contrast, the Mediterranean Sea, nearly enclosed and connected to the Atlantic only through the narrow Strait of Gibraltar, has ranges of less than a foot in most areas.
Continental shelf width and depth also matter. Shallow, broad continental shelves slow the tidal wave as it approaches the coast, allowing water to pile up. Deep ocean basins have smaller tidal ranges for the same reason that waves in deep water have a very different character than waves in shallow water.
Basin resonance is the most complex local factor. Just as a bathtub of water has a natural sloshing frequency, ocean basins have resonant periods. When the tidal forcing frequency matches the resonant frequency of the basin, tides are amplified dramatically — this is called resonance. The Bay of Fundy resonant period of roughly 12.4 hours nearly matches the semidiurnal tidal period of 12 hours and 25 minutes, which is why its tides are so extreme.
Before sailing to an unfamiliar area, check the tidal range for that specific location. A sailor used to East Coast ranges of 2 to 4 feet who sails to Maine (6 to 10 feet) or Nova Scotia (15 to 50 feet) will encounter dramatically different conditions for anchoring depth, dock height, tidal current strength, and the exposure of hazards at low water.
What Is Current and What Causes It?
Current is the horizontal movement of water. Unlike tide, which is vertical rise and fall, current is the flowing motion of that water, and it affects a vessel's actual path through the water independently of where the bow is pointed. A boat heading north in a 2-knot current flowing east will actually travel northeast, regardless of where the bow is pointed.
Tidal current is the most common current coastal sailors encounter. As the tide floods (rises), water flows into bays, rivers, and inlets. As it ebbs (falls), water flows out. The strength of tidal current depends primarily on tidal range and the geometry of the waterway. Narrow channels and constricted inlets concentrate flow and amplify current speed; more water must pass through a smaller opening in the same time.
Ocean currents (e.g., The Gulf Stream, California Current, North Atlantic Gyre) are large, persistent flows driven by wind patterns, temperature differences, Earth's rotation (the Coriolis effect), and differences in water density caused by salinity and temperature. These matter significantly for offshore passages but have little relevance in sheltered coastal and estuarine waters.
Wind-driven current is surface water pushed by sustained winds. Strong winds blowing over open water for an extended period create a surface drift current. This is significant in open bays and coastal waters after prolonged strong wind — particularly in shallow areas where the entire water column can be set in motion.

In a narrow channel connecting a bay to the ocean, where is tidal current strongest?
The tide is flooding. In a tidal river that drains to the sea, the current is flowing:
How Tides Generate Currents: Timing and the Rule of Twelfths
Tidal current is the direct hydraulic consequence of water trying to fill or drain from an enclosed or semi-enclosed area as sea level rises and falls. But the timing of maximum current and the timing of high or low water are not the same, and confusing them is a common navigational error.
At most coastal locations, the relationship between tide height and current follows a predictable pattern. Maximum flood current typically occurs near mid-tide on a rising cycle — roughly 3 hours before high water. The flood current weakens as the tide approaches high water and essentially stops (slack) at or slightly after high tide. Maximum ebb similarly occurs near mid-tide on a falling cycle — roughly 3 hours after high water, or 3 hours before low water.
There is also a current lag: after the tide turns from high to low (or low to high), tidal current does not reverse instantly. At many locations there is a lag of 30 minutes to 2 hours before the current actually changes direction. The water level has turned, but the horizontal flow takes time to respond. Current tables list slack water times independently from tide height predictions for exactly this reason.
Always check tidal current predictions separately from tide height predictions. They are published in separate tables and the times are different. Maximum current typically occurs near mid-tide, not at high or low water. Slack water near high or low water is approximate. The current table gives you the actual times.
The Rule of Twelfths
The rule of twelfths is a simple mental model for estimating how quickly the tide rises or falls during each hour of the tidal cycle. The total tidal range is divided into twelfths, and the fraction of that range that changes each hour follows the pattern: 1, 2, 3, 3, 2, 1.
In the first hour after low water, the tide rises 1/12 of its total range. In the second hour, it rises 2/12. In the third hour, 3/12 — the fastest rate of change. The fourth hour also accounts for 3/12, the fifth hour 2/12, and the sixth hour 1/12, bringing it to high water.
Example: If the total tidal range is 12 feet and low water was at 0600, by 0700 the tide has risen about 1 foot (1/12). By 0800, another 2 feet — now 3 feet above low. By 0900, another 3 feet — 6 feet above low, halfway through the range. The tide is moving fastest around mid-cycle.
Tidal current follows a similar accelerating-then-decelerating pattern: slowest near slack water (at the extremes of the tide), fastest near mid-tide. This is why slack water is brief — the current reverses slowly, accelerates through the middle of the cycle, and slows again as the next slack approaches. The rule of twelfths gives you a rough timing tool for both the height change and the associated current cycle.
When Current Does Not Follow the Simple Model
In rivers with significant freshwater flow, the river current and the tidal current interact. During ebb, both push seaward and currents can be extremely strong. During flood, the tidal current fights the river's outflow and the net current may barely reverse even at peak flood. In some rivers during high river flow, the tidal current never fully reverses.
At tidal inlets (narrow passes between ocean and bay) the geometry can create hydraulic conditions where maximum current occurs at or near the moment of high or low water rather than mid-tide, particularly if the inlet is small relative to the bay it serves. The bay takes time to fill and empty, creating a persistent head of water that drives strong flow even at the turn of the tide.
Always use local current tables rather than applying a generic model. The standard timing rules are approximations that hold reasonably well in open coastal waters but can be significantly wrong in complex inlet, estuary, and river environments.
Using the rule of twelfths, if low water is at 0600 and the tidal range is 6 feet, how much has the tide risen by 0900?
High water at a harbor entrance is predicted at 1400. When should you expect maximum ebb current to occur nearby?
Surge: When Weather Overrides the Predictions
Tide tables are astronomical predictions. They describe what the ocean would do if only the Moon and Sun were influencing it. In practice, weather — wind and atmospheric pressure — can push actual water levels significantly above or below the prediction. This deviation is called surge.
Wind surge occurs when sustained wind blows surface water toward a coast or into a bay. Onshore winds (blowing from sea toward land) pile water against the coast, raising sea level above the predicted tide. Offshore winds do the opposite, lowering the surface. Prolonged strong winds in a shallow, enclosed bay can raise or lower water levels by a foot or more. In severe storms, wind surge is the dominant factor.
Pressure surge occurs because the atmosphere pushes down on the ocean surface. High atmospheric pressure suppresses the surface slightly; low pressure allows it to rise. The relationship is approximately 1 millibar of pressure drop equals 1 centimeter (about 0.4 inches) of sea level rise. A deep low-pressure system at 960 millibars compared to a standard 1013 millibars represents about 53 millibars of difference — roughly 53 centimeters (21 inches) of potential pressure surge, before wind effects are even considered.
Storm surge is the combined effect of wind and pressure during a storm system. During a major hurricane or intense extratropical storm, storm surge can raise water levels 10, 15, or 20 feet above predicted tide. This is why storm surge is the leading cause of hurricane-related fatalities in coastal areas — it inundates ground that is well above the predicted tide level.
Tide table predictions are astronomical. They do not account for weather. In any storm, strong wind, or significant pressure system, actual water levels can differ from predictions by a foot or more — sometimes several feet. Always combine tide predictions with current weather data before navigating shallow or marginal waters.
How Surge Interacts with Tidal Current
Surge does not just change water height — it also affects the direction and strength of tidal current. When wind blows onshore during an ebb tide, the surge-driven inflow can partially or fully cancel the ebbing tidal current. A channel that would normally have 2 knots of ebb during a storm might have near-zero net current, or even a flood-like flow, as wind-driven water pushes against the ebb.
Conversely, a strong offshore wind during an ebb tide will enhance the ebb current, combining the tidal outflow with the wind-driven surface drift. Current that might be 2 knots under normal conditions can temporarily reach 3 or 4 knots.
The practical consequence for sailors: after any significant weather event, tidal current predictions based on the astronomical tables may not match actual conditions. Use the tables as a starting point, then verify with visual observation — leaning buoys, floating debris, wake patterns — before committing to a difficult passage.
Negative Surge and Surprisingly Low Water
Surge can also lower water below predicted levels. When strong offshore winds blow water away from the coast, or when high atmospheric pressure holds the surface down, the tide may not reach its predicted low — it may fall even lower. A predicted low of 0.5 feet at MLLW could become -0.5 feet if a 15-millibar pressure surge is pushing water out of the bay.
This matters in shallow harbors, tidal channels, and anchorages where low-water depth is marginal. A boat that anchored based on predicted low water depth may find itself sitting in less water than expected during a wind-driven negative surge event. Always build more safety margin into low-water calculations than the charts and tide tables alone suggest.
Measuring and Predicting Water Height
Chart datum in the United States is Mean Lower Low Water (MLLW) — the average height of the lower of the two daily low tides, averaged over a 19-year tidal epoch. All charted depths are referenced to this level. On most days there is more water than the chart shows; at very low tides the actual depth may approach or even fall below the charted sounding.
Actual water depth at any moment equals the charted depth plus the current tide height above chart datum, plus any surge. Written as a formula: actual depth = charted depth + tide height + surge. All three terms must be considered for accurate depth assessment in shallow water.
NOAA publishes tide predictions online and in annual tide tables for hundreds of reference stations around the U.S. coast. Subordinate stations — nearby locations without their own direct measurement equipment — have correction factors (differences in time and height) that are applied to the nearest reference station prediction. These corrections are published in the tide table's subordinate station listings.
Example: Working Through a Depth Calculation
Scenario: You want to cross a tidal bar with a charted depth of 6 feet. Your boat draws 5 feet, and you want a minimum 2-foot safety margin, requiring at least 7 feet of actual depth.
From the tide table, predicted tide height at your planned crossing time (1500) is 3.2 feet above MLLW. A coastal weather station reports no significant surge. Actual depth at 1500: 6 + 3.2 = 9.2 feet. Margin: 9.2 - 5 = 4.2 feet. Safe to cross.
Now consider the return at 1830. Predicted tide height at 1830 is 0.4 feet. Actual depth: 6 + 0.4 = 6.4 feet. Margin: 6.4 - 5 = 1.4 feet. This is less than your 2-foot safety margin. The bar is marginal and should be reconsidered — either leave earlier while more tide remains, or wait for the next flood cycle.
Add a weather variable: suppose an offshore wind at 1830 creates a 0.5-foot negative surge. Actual depth: 6 + 0.4 - 0.5 = 5.9 feet. That is only 0.9 feet of clearance for a 5-foot draft boat. This is a grounding waiting to happen.
Sources of Tide and Current Data
NOAA Tides and Currents is the primary free source of predictions for U.S. waters. It provides tide height predictions, tidal current predictions (separate tables), real-time water level data from tide gauges, and historical data. Current predictions are available for a smaller set of reference stations than tide predictions, with subordinate station corrections available in the annual tidal current tables.
Commercial chart applications — Navionics, C-Map, Garmin ActiveCaptain, and others — integrate tide and current predictions directly into the chart display. Many allow you to click on any tidal station or current station and view predictions for any date and time. These are convenient for voyage planning but should be understood as predictions, not real-time measurements.
Real-time water level observations are available from NOAA's network of tide gauge stations. During unusual weather events, real-time data is far more valuable than predictions — it shows what is actually happening, not what the astronomy predicts.
A chart shows 4 feet at a shoal. Tide height is 2.5 feet above MLLW. An offshore wind is creating 0.8 feet of negative surge. What is the actual depth?
You need at least 7 feet of water under your keel and carry 1 foot of safety margin. Your draft is 5 feet. The minimum actual depth required is:
Tidal Current vs. the Tidal Cycle
Flood current and ebb current are the two phases of tidal current — but they do not start and stop when the tide turns. This distinction is one of the most important — and most commonly misunderstood — aspects of tidal navigation.
Slack water is the brief period when tidal current is minimal — near zero — typically between the end of one current direction and the start of the other. Slack water is the ideal time to transit challenging passages: tidal inlets, narrow channels with opposing current, rapids, and tidal rivers where current makes maneuvering hazardous. The word brief is important. Slack water in a constricted inlet can last as little as 10 to 15 minutes before the current builds again.
Current speed varies predictably through the tidal cycle: slow near slack, building to maximum during mid-cycle, then slowing again toward the next slack. The pattern roughly follows the same accelerating-decelerating curve as the rule of twelfths described in the previous section — but for current strength rather than tide height.
NOAA publishes tidal current predictions at tidesandcurrents.noaa.gov — check them separately from tide height predictions. The current table gives you slack water times, maximum flood, and maximum ebb, all with different times than the tide table for the same location.
Identifying and Measuring Current
Current is invisible — you cannot see it directly. You infer it from observable clues, from GPS data, and from understanding what the tide is doing. All three together give you a clear picture of current conditions.
Visual clues are often the most immediate. Wind-against-tide chop occurs when wind direction and current oppose each other — the sea surface becomes short, steep, and confused, rougher than the wind alone would suggest. Eddies behind headlands and obstructions indicate current flowing past a discontinuity in the coastline. Floating debris, lobster pot buoys, or marker floats leaning downstream show both current direction and give a rough sense of speed.
GPS chartplotters display both heading (where the bow is pointed) and course over ground (COG) — where the boat is actually tracking across the bottom. The angular difference between these two is caused by current and leeway combined. If your heading is 090° and your COG is 075°, something is setting you 15° to the south. If the wind is calm or from ahead, that is current. If the wind is from the north, leeway may be contributing.
A related GPS observation: watch your boat's speed through water (from a paddlewheel log or speed sensor) versus speed over ground (SOG from GPS). If you are making 6 knots through the water but only 4 knots over ground, a 2-knot head current is slowing you. If SOG exceeds water speed, a favorable current is helping. This difference, measured over a known period, gives you the current speed along your track.
You are approaching a tidal inlet near the end of flood tide. The surface looks deceptively calm. But a lobster buoy 200 yards ahead is leaning at 30 degrees from vertical — the strap is pulling downstream. As you enter, your chartplotter shows COG 270° while your heading is 285° — a 15-degree set to the south. The flood is still running despite the tidal height being near its peak. You need to steer 15 degrees north of your intended track to compensate and hold the channel centerline.
Your GPS shows heading 045° and COG 060°. What does this most likely indicate?
Your boat speed through water is 5 knots. Speed over ground is 7.5 knots. What does this tell you?
Planning with Tides, Currents, and Surge
Effective tidal planning integrates three separate information streams: tide height predictions for depth calculations, tidal current predictions for timing and set/drift, and weather data for surge. Combining all three before a passage is what separates prudent seamanship from guesswork.
For passage timing, the fundamental question is whether you want to ride a favorable current, avoid a contrary current, or transit at slack water. These goals sometimes conflict — slack water may occur at a poor tide height for a shoal crossing, or maximum favorable current may coincide with a hazardous sea state at the entrance to a tidal inlet. Working through these trade-offs in advance — at anchor, not in the channel — is essential.
Set and drift planning is the process of predicting where current will push your boat over the course of a passage and adjusting your steering accordingly. Set is the direction the current flows (the direction it pushes your boat toward). Drift is the speed of the current in knots. If you know the set is 270° (westward) at 1.5 knots for a 3-hour passage, you can calculate in advance how far west you will be pushed and steer an adjusted course to arrive at your intended destination.
Favorable Current Tactics
Riding a favorable current significantly reduces passage time and fuel consumption. A boat making 6 knots through water in a 2-knot favorable current covers 8 miles per hour over ground — a 33% improvement. Over a 60-mile passage this saves nearly 2.5 hours of sailing time.
Timing a departure to maximize favorable current is a standard coastal piloting technique. For a route through a tidal inlet, the goal is typically to arrive at the inlet entrance just as flood current begins (for an inbound trip) or just as ebb begins (for an outbound trip), riding the current through the most constricted and current-sensitive section of the route.
In rivers with strong tidal current, the difference between a favorable and contrary current is dramatic. A boat doing 5 knots through water against a 4-knot ebb covers only 1 knot over ground — 3 hours to cover 3 miles. Wait for the ebb to turn and the same passage takes 20 minutes with a favorable flood adding to boat speed.
Slack Water Transits
Some passages are manageable at any tide but dangerous — or even impossible — in strong current. Tidal inlets with breaking conditions on the ebb, rock-strewn channels that require precise boat handling, and narrow bridges or locks all benefit from a slack water transit.
The challenge with slack water is that it is brief. In a strongly constricted inlet, slack water may last 10 to 20 minutes. If you aim to be in the inlet channel at slack and arrive 30 minutes late, you may be transiting in building current. Always aim to arrive at the entrance before predicted slack, not after.
Current tables list predicted slack water times, but remember the astronomical caveat: weather can shift the actual slack by 30 minutes or more. Strong onshore winds during an ebb can delay the flood current's onset. Check weather and build in buffer time.
Example: Combining All Three Factors
Scenario: You want to enter a harbor across a tidal bar with a charted depth of 6 feet. Your draft is 5 feet. You need at least 1 foot of clearance. A southwest wind at 20 knots has been blowing for 12 hours.
Tide table: Predicted low water at 1030 is 0.2 feet. High water at 1630 is 4.1 feet. You plan to cross at 1400.
Rule of twelfths: Low was at 1030. By 1400 (3.5 hours later), the tide has risen approximately 1/12 + 2/12 + 3/12 + half of 3/12 = roughly 7.5/12 of the 3.9-foot range = about 2.4 feet above the low of 0.2 feet = 2.6 feet above MLLW.
Surge estimate: The 20-knot southwest wind has been blowing onto the coast. Check local buoy data or port authority water level. Real-time data shows +0.4 feet above predicted. Actual water height at 1400 estimated at 2.6 + 0.4 = 3.0 feet above MLLW.
Depth calculation: 6 + 3.0 = 9 feet of actual depth. Clearance: 9 - 5 = 4 feet. Safe to cross with a comfortable margin.
Current check: The current table shows maximum flood at 1330 at 1.4 knots, ebbing to 0.3 knots by 1445. At 1400 you are in the tail end of flood — current is with you entering the harbor. Good timing.
You are heading into a tidal inlet with a 3-knot maximum ebb current. Your engine gives you 5 knots through water. You want to enter with favorable current. The best strategy is:
Slack water at a tidal inlet is predicted for 1200. You want to arrive before slack. The earliest sensible arrival is:
Summary
Tides are caused by the gravitational pull of the Moon (dominant) and Sun on Earth's oceans, creating two tidal bulges. As Earth rotates through them, most coasts experience two high and two low tides per lunar day of 24 hours 50 minutes — which is why tides shift approximately 50 minutes later each day.
Tidal patterns vary by location: semidiurnal (two equal highs/lows — East Coast), diurnal (one high/one low — parts of Gulf), and mixed semidiurnal (two unequal highs/lows — West Coast).
Spring tides (larger range, stronger currents) occur at new and full moon when the Sun and Moon align. Neap tides (smaller range, weaker currents) occur at quarter moons when they are at right angles.
Local geography amplifies or suppresses tides. Funnel-shaped bays concentrate tidal energy and increase range dramatically. The Bay of Fundy exceeds 50 feet. Enclosed seas like the Mediterranean have ranges under 1 foot.
The rule of twelfths: the tide rises or falls 1, 2, 3, 3, 2, 1 twelfths of its total range in successive hours. The middle two hours of the cycle see the fastest rate of change in both tide height and associated tidal current.
Maximum flood or ebb current occurs near mid-tide — approximately 3 hours before or after the high or low. Current does not reverse immediately when the tide turns — there is a lag of 30 minutes to 2 hours. Check current tables separately from tide tables.
Surge deviates actual water levels from the astronomical prediction. Onshore wind and low pressure raise water; offshore wind and high pressure lower it. In storms, surge can exceed the tidal range by several feet. Real-time gauge data is more reliable than predictions during weather events.
Actual depth = charted depth + tide height + surge. Include all three terms for accurate shallow-water assessment.
Favorable current planning: riding a 2-knot current in a 60-mile passage saves over 2 hours. Slack water timing: arrive early, build in weather buffer, and be in position before predicted slack — not after.
GPS heading versus COG reveals current direction and magnitude. Speed over ground minus speed through water gives current speed along track. Visual clues — leaning buoys, eddies, wind-against-tide chop — provide real-time confirmation.
Key Terms
- Tide
- The periodic vertical rise and fall of sea level caused by the gravitational pull of the Moon and Sun on Earth's oceans.
- Lunar day
- The time between successive alignments of the same location on Earth with the Moon — approximately 24 hours and 50 minutes. Tides follow this cycle, shifting roughly 50 minutes later each calendar day.
- Lunar Cycle
- The ~29.5-day cycle of the Moon’s phases that drives changes in tidal range through variations in gravitational alignment with Earth and the Sun.
- Semidiurnal tide
- Two high tides and two low tides per lunar day, of approximately equal heights. The dominant pattern on the U.S. East Coast.
- Diurnal tide
- One high tide and one low tide per lunar day. Occurs in parts of the Gulf of Mexico and some other enclosed or semi-enclosed seas.
- Mixed semidiurnal tide
- Two high tides and two low tides per day, but of significantly unequal heights. Common on the U.S. West Coast.
- Spring tide
- Tides with the largest range, occurring at new moon and full moon when the Sun and Moon align and their tidal forces combine.
- Neap tide
- Tides with the smallest range, occurring at quarter moons when the Sun and Moon are at right angles and their tidal forces partially cancel.
- Perigean spring tide
- An exceptionally large spring tide occurring when the Moon is also at perigee (its closest point to Earth), maximizing gravitational pull. Sometimes called a king tide.
- Rule of twelfths
- A rule of thumb for estimating tidal height change per hour: the tide rises or falls 1, 2, 3, 3, 2, 1 twelfths of its total range in successive hours from low to high (or high to low).
- Chart datum
- The reference water level from which all charted depths are measured. In the U.S. this is Mean Lower Low Water (MLLW), near the lowest predictable tide level.
- MLLW
- Mean Lower Low Water. The U.S. chart datum — the average height of the lower of the two daily low tides. All NOAA chart soundings are referenced to this level.
- Current
- The continuous, directed movement of water in the ocean or coastal areas caused by forces such as tides, wind, and differences in water density.
- Tidal Current
- The horizontal flow of water caused by rising and falling tides, reversing direction between flood and ebb and varying in strength based on local geography.
- Flood
- Tidal current flowing inland as the tide rises. The direction of flow may not be apparent from the lay of the land.
- Ebb
- Tidal current flowing seaward as the tide falls. The direction of flow may not be apparent from the lay of the land.
- Slack water
- The brief period of minimal tidal current between flood and ebb (or ebb and flood). Optimal time to transit difficult passages.
- Maximum flood / maximum ebb
- The period of strongest tidal current in each direction — typically occurring near mid-tide, approximately 3 hours before high or low water.
- Current lag
- The delay — typically 30 minutes to 2 hours — between the turn of the tide and the reversal of tidal current direction.
- Surge
- Temporary deviation of actual water level from the predicted astronomical tide, caused by wind and atmospheric pressure. Onshore wind and low pressure raise the surface; offshore wind and high pressure lower it.
- Storm surge
- The combined wind and pressure surge produced by a storm system, potentially raising water level many feet above predicted tide.
- Set
- The direction toward which a current is flowing — the direction it pushes a vessel.
- Drift
- The speed of a current in knots — how fast it is pushing a vessel.
- Course over ground (COG)
- The actual direction a vessel is tracking over the bottom, as measured by GPS. May differ from heading due to current or leeway.
- Wind-against-tide
- Condition where wind direction and tidal current oppose each other, creating steep, short, confused seas rougher than the wind alone would produce.
Tides and Currents
Why do tides occur approximately 50 minutes later each day rather than exactly every 24 hours?
Spring tides produce larger tidal range than neap tides. When do spring tides occur?
Using the rule of twelfths, if a tidal range is 12 feet and the tide starts rising from low water at 0600, how much has it risen by 0800?
A chart shows 5 feet at a shoal. Tide is 2 feet above MLLW. An onshore wind is creating 0.6 feet of positive surge. Your boat draws 4.5 feet. Can you safely cross with a 1-foot safety margin?
In a narrow tidal channel with a 4-knot ebb current, a boat with a maximum speed of 6 knots is traveling against the ebb. What is its speed over ground?
You are heading 000° (north) and your chartplotter shows COG of 340°. The wind is calm. What is the most likely explanation?
Slack water at a tidal inlet is predicted for 1300. A 25-knot offshore wind has been blowing since midnight. The most prudent approach is:
References & Resources
Related Links
-
NOAA Tides and Currents
Free tide predictions, tidal current predictions, and real-time water level data for hundreds of U.S. stations. Tide and current tables are listed separately.
-
NOAA — Tidal Current Tables
Annual tidal current tables for reference stations on U.S. coasts, with subordinate station correction factors.