Nautical Charts
Reading the map of the sea — what charts show and how sailors use them
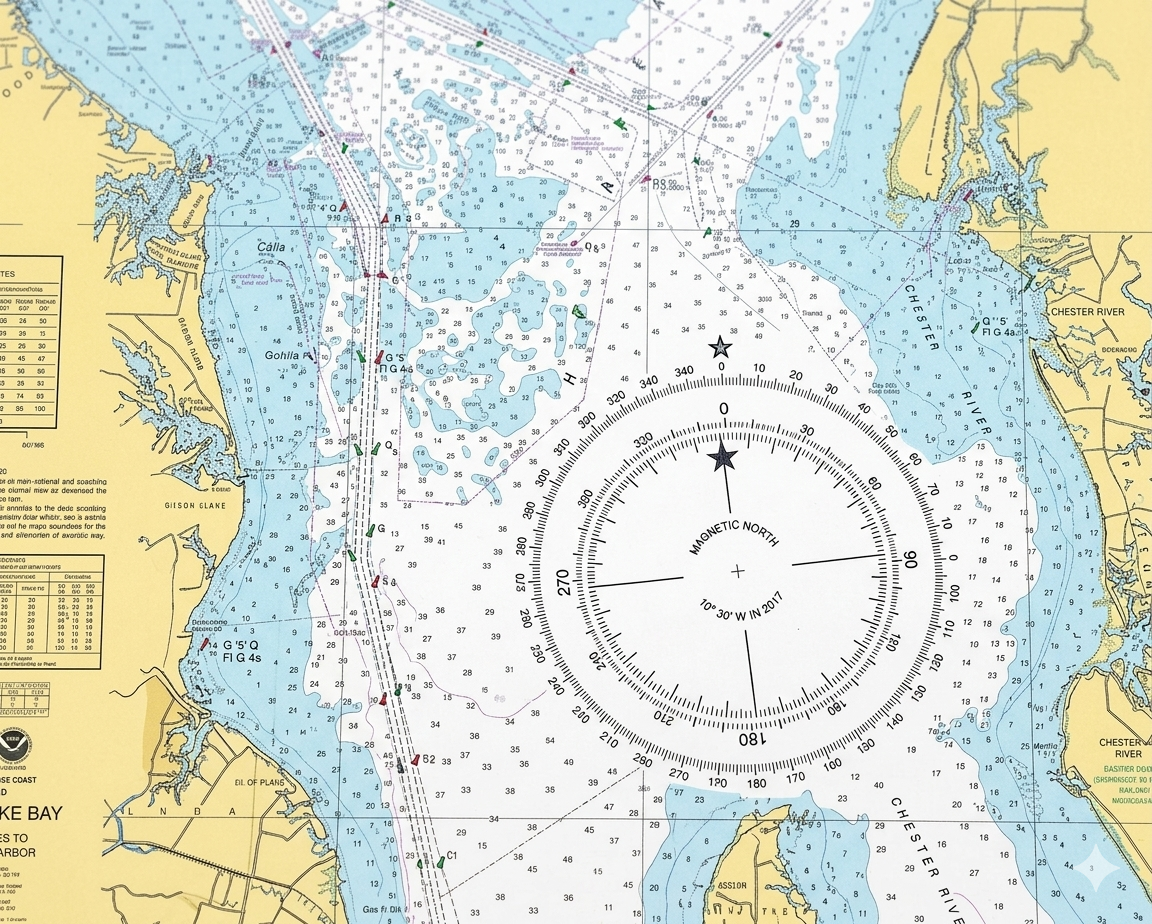
What a Nautical Chart Shows
A nautical chart is a highly specialized map designed specifically for marine navigation. Unlike land maps, nautical charts are equally focused on what lies under the water as on what lies above it — all with one practical question in mind: is there enough water here to float my boat safely?
Charts convey essential information that helps you plan, fix your position, avoid hazards, and execute your route confidently:
- Water depths (soundings): Show how deep the water is at specific locations, usually referenced to a tidal datum. These help you assess whether there's sufficient depth for your vessel's draft.
- Submerged hazards: Rocks, shoals, wrecks, reefs, and other underwater dangers are marked so you can steer clear of them.
- Aids to navigation: Buoys, beacons, lighthouses, and range markers provide visual or electronic references that help confirm your position and guide course adjustments.
- Coastal features: Harbors, channels, anchorages, and distinctive shoreline shapes help orient you and support visual navigation.
- Tidal and current information: Many charts include tide ranges and stream arrows or notes indicating current behavior in the area.
- Limited land detail: Details of land immediately adjacent to the coast are included to support visual fixes and bearings on prominent features.
Chart Format Types: Paper/Raster and Vector
Charts today are available in forms that support different navigation workflows. Understanding these formats helps you choose the right tools for your navigation style.
Paper and Raster Charts
For centuries, mariners used paper nautical charts to plan and execute coastal passages, plotting courses and fixes with dividers, parallel rulers, and a pencil. These charts show depth, hazards, and shoreline detail exactly as sailors have traditionally read them.
Raster navigational charts (RNCs) are the digital equivalent: georeferenced images of traditional paper charts that could be displayed on a screen and overlaid with a GPS position. However, NOAA has sunset its production and maintenance of paper and raster charts, completing the cancellation of the last NOAA paper and raster charts in December 2024 as part of a broader transition to digital formats. All traditional NOAA chart products, including paper prints and raster navigational charts, have now been discontinued as official navigational products.
This means that while historical raster charts may still be accessible in archives, they are no longer updated nor supported as official navigational tools — and they do not fulfill U.S. Coast Guard carriage requirements for regulated vessels.
Vector Charts (ENCs – Electronic Navigational Charts)
The modern standard for electronic navigation is the Electronic Navigational Chart (ENC). ENCs are data-driven vector charts in which every feature — depth contours, buoys, lights, hazards, and more — is encoded as discrete elements. A chartplotter or navigation system can interpret these vector elements to display real-time GPS positions and tracks, show or hide layers of information, trigger depth or hazard alarms, support automated route planning and updating, and integrate AIS, radar, and weather data.
Because ENCs contain structured data rather than fixed images, they are far more flexible and interactive than raster charts. They are the primary format used in modern electronic navigation and the only chart type NOAA now maintains as its official navigational product.
Why This Matters to Sailors
Whether you're planning with charts on paper, a tablet, or a chartplotter, the underlying information is the same — showing depths, hazards, navigation aids, and coastal features essential for safe navigation. However, the format you choose affects how you interact with that information:
- Traditional sailors who enjoy hands-on plotting and bearings may still create paper charts from digital ENCs (for example, using print-to-PDF tools), but these are derived from vector data rather than NOAA's old raster products.
- Digital sailors benefit from ENCs' real-time updates, live GPS overlays, automated alarms, and seamless integration with other onboard systems.
- Hybrid sailors can combine methods — using vector charts on a chartplotter for efficiency while referencing printed sections or manual plotting during critical phases of a passage.
Regardless of format, understanding what a nautical chart shows — and how to interpret its symbols — is central to effective coastal navigation.
What is the primary question a nautical chart is designed to help answer?
What is the key difference between raster and vector electronic charts?
Depth, Datum, and Soundings
Every depth number, or sounding, on a nautical chart is measured from a reference level called the chart datum. In the United States and many other countries, this reference is Mean Lower Low Water (MLLW) — the average height of the lower of the two daily low tides.
It is important to understand that charted depths are reference values, not actual water under the keel. The true water depth at any given time depends on tides, weather, and currents, among other factors. For example, a charted depth of 6 feet at MLLW with a 2-foot tide gives approximately 8 feet of water at that moment.

Charted depth at the harbor entrance: 8 feet. Current tide height above datum: 3.5 feet. Actual depth now: 8 + 3.5 = 11.5 feet.
Your boat draws 5 feet. With a 2-foot safety margin, you need at least 7 feet. 11.5 feet is safe to proceed — but return at low tide and the charted 8 feet may only give you 8 − 0.5 (a slight negative tide) = 7.5 feet. Much tighter.
Sounding Units
Soundings on charts are expressed in a variety of units, which have evolved over time and differ between regions. Understanding the units is critical for safe navigation.
Common Units Used
- Feet (ft): Traditional unit on many older U.S. charts, particularly paper charts published before the 1980s. Most older coastal and harbor charts use feet exclusively.
- Meters (m): Standard on modern U.S. charts and nearly all international charts today. Vector ENCs and electronic charts predominantly use meters.
- Fathoms: One fathom equals 6 feet. Older charts, especially those published in the 19th and early 20th centuries, often show depths in fathoms, sometimes with feet or meters in parentheses.
How Sounding Units Appear on Charts
- Legend: The chart legend indicates the unit used (ft, m, or fathoms). Always verify the legend before interpreting depths.
- Mixed units: Some older charts mix units, such as fathoms for deeper water and feet for shallow areas. Be aware of this to avoid misreading.
- Electronic charts: Modern ENCs standardize units digitally, typically in meters, and allow automatic conversion for display preferences.
Practical Considerations
- Unit awareness: Misinterpreting units can be dangerous. Confusing feet and meters could mean underestimating depth by a factor of three, potentially causing grounding.
- Converting units: Keep a small conversion reference handy if you navigate with older charts in feet or fathoms. Quick conversions: 1 meter ≈ 3.28 feet; 1 fathom = 6 feet ≈ 1.83 meters.
- Drying areas: Italicized soundings indicate areas that may dry out at low tide — typically tidal flats, shoals, or sandbars.
- Depth contours: Dotted or solid lines connect points of equal depth, helping visualize underwater slopes, channels, and shoals — similar to topographic maps on land.
Historical Context and Old Chart Terminology
Older charts may use different datums or units:
- MLW (Mean Low Water): Average of all daily low tides. Less conservative than MLLW.
- LLW (Lower Low Water): Lower of two daily lows, sometimes unaveraged.
- LAT (Lowest Astronomical Tide): International standard in many countries; slightly lower than MLLW.
- Fathoms and feet: Older charts often used fathoms for deep water, feet for shallow areas, or both.
Always check the chart legend and margin notes for unit and datum information when using legacy paper charts to avoid misinterpretation.
Key Takeaways
- Charted depths are reference values, not exact water depth. Always account for tides, weather, and currents.
- Units vary: Feet, meters, and fathoms are common — verify the chart legend before interpreting any sounding.
- Historical charts may use older datums and units — understanding these conventions is essential when interpreting legacy paper charts.
- Contours and italicized soundings provide context about underwater slopes and areas that may dry at low tide.
A chart shows 6 feet at a channel entrance. The current tide height is 2 feet. What is the actual depth?
What does 'chart datum' refer to?
Chart Scale and Coverage
Chart scale describes how much the real world is reduced to fit on the chart. A large-scale chart (e.g. 1:10,000) shows a small area in great detail — ideal for harbors, anchorages, and coastal passages. A small-scale chart (e.g. 1:500,000) shows a large area with less detail — useful for passage planning across open water.
A common confusion: 'large scale' sounds like it should mean a big area, but it means a large fraction — 1/10,000 is larger than 1/500,000. Think of it as zooming in (large scale = zoomed in = more detail).
Always use the largest scale chart available for the area you're actually navigating. Small-scale charts omit hazards that are charted in detail on larger-scale versions. In confined or complex waters — channels, harbors, anchorages — the largest scale chart available is essential, not optional.
When approaching an unfamiliar harbor, switch from your ocean passage chart (small scale) to the harbor chart (large scale) well before entering. The larger-scale chart shows rocks, shoals, and channel markers that are invisible on the passage chart.
You are approaching a complex harbor entrance. Which chart scale should you use?
Which of the following is a large-scale chart?
Planning and Monitoring a Passage
Before leaving, passage planning involves marking a route on the chart that avoids all hazards with appropriate margins. Plot waypoints at safe turning points, note the minimum depths along the route, check for hazards at low tide, and identify alternates (bail-out harbors) in case conditions change.
Monitoring position during the voyage involves regularly checking your actual position against the chart — whether through GPS, visual bearings, or dead reckoning. Mark your position at regular intervals. This continuous loop of planning, monitoring, and updating separates systematic navigators from those who are lost and don't know it yet.
Charts require updating as buoys move, new hazards are discovered, and channels change. NOAA (in the US) provides chart corrections through Notice to Mariners. Always confirm that your chart covers the current edition, especially in areas with frequent changes like dredged channels and port approaches.
When passage planning on a chart, what is the most critical check for every waypoint on your route?
Why should charts be checked for currency (latest edition) before use?
Summary
Nautical charts show depth, hazards, navigation aids, and coastal features — all organized around the question of whether there's enough water.
Actual depth = charted depth + current tide height. Chart datum (MLLW in the US) is near the lowest expected water level.
Large-scale charts show small areas in great detail; always use the largest scale available for your actual navigation area.
Passage planning means plotting a safe route, checking minimum depths at lowest tide, and marking alternates.
Check chart currency — buoy positions, channel depths, and hazards change. Use updated charts and current Notice to Mariners corrections.
Key Terms
- Nautical chart
- A specialized map of marine areas showing depth, hazards, navigation aids, and coastal features for safe navigation
- Sounding
- A depth measurement charted on a nautical chart, measured from chart datum
- Chart datum
- The reference water level from which all depths are measured — typically MLLW (Mean Lower Low Water) in the US
- MLLW
- Mean Lower Low Water — the average of the lower of the two daily low tides; the standard US chart datum
- Large-scale chart
- A chart with a large fraction scale (e.g. 1:10,000) showing a small area in great detail
- Small-scale chart
- A chart with a small fraction scale (e.g. 1:500,000) showing a large area with less detail
- Raster chart
- An electronic chart created by scanning a paper chart; accurate but pixelates at high zoom
- Vector chart
- A data-driven electronic chart allowing smooth zoom, layer toggling, and GPS integration
- Danger sounding
- The minimum depth the skipper has defined as safe for the vessel's draft plus safety margin
Nautical Charts — Quiz
Your chart shows 4 feet at a bar. Your draft is 5 feet. The tide height is currently 3 feet above datum. Is it safe to cross?
What does 'chart datum' represent?
You are entering a marina in an unfamiliar harbor. You have a 1:100,000 coastal chart and a 1:10,000 harbor chart. Which do you use?
Soundings on a chart shown in italics typically indicate:
Which of the following best describes a passage planning best practice?
References & Resources
Related Links
-
NOAA — Free Nautical Charts
NOAA provides free, downloadable nautical charts for US waters in raster and vector formats.
-
NOAA — Chart No. 1 (Symbols, Abbreviations, and Terms)
The official reference for all US nautical chart symbols, abbreviations, and conventions.